The PowerQuant™ System: A New Quantification Assay for Determining DNA Concentration and Quality
Promega Corporation
Publication Date: 2014
Introduction
Accurate quantification of human DNA extracted from evidentiary items is essential for an efficient forensic short tandem repeat (STR) analysis workflow. Measured DNA concentrations are used to normalize the amount of DNA template to an optimal range for STR amplification reactions, ensuring STR profiles are in the linear range of the capillary electrophoresis instrument with minimal artifacts and stochastic effects. Commercially available qPCR assays are routinely used to determine the concentration of total human DNA as well human male DNA. DNA recovered from casework samples encompasses a wide range of DNA quality. The PowerQuant™ System amplifies target sequences to quantify total human DNA, quantify total human male DNA, assess the level of DNA degradation and detect PCR inhibitors in the DNA sample. The combination of data obtained from each target may be used to choose the optimal DNA template for amplification, the most appropriate STR system (autosomal or Y-STRs) or a process for screening a high volume of samples and determine whether the sample is likely to contain STR amplification inhibitors.
The PowerQuant™ System
The PowerQuant™ System is a five-dye, four-target qPCR multiplex using hydrolysis probe technology (1) . The system includes three multi-copy targets (autosomal, Y and degradation), an IPC and a passive reference, each in a different dye channel. Amplification of the autosomal target determines the total human DNA concentration, and the Y amplification determines the human male DNA concentration in an extracted sample. The degradation target evaluates the degree of DNA degradation. The IPC target is an internal control for the amplification reaction and assesses whether or not PCR inhibitors are present. The recommended protocol for the PowerQuant™ System uses a four-point standard curve created from serial dilution of the PowerQuant™ Male gDNA Standard (Figure 1). DNA quantification using the PowerQuant™ System provides rapid results with a thermal cycling protocol on the Applied Biosystems® 7500 Real-Time PCR System that requires approximately 1 hour. All qPCR samples presented here were amplified using the Applied Biosystems® 7500 Real-Time PCR System with 7500 Software Version 2.0.6.
 Figure 1. Overlaid duplicate four-point standard curves for the autosomal, Y and degradation targets in the PowerQuant™ System.
 Sensitivity
The PowerQuant™ System determines DNA concentration and allows the analyst to decide whether or not sufficient DNA template is present to generate an interpretable STR profile. Male genomic DNA from four different individuals was diluted to four different concentrations: 100pg/µl, 10pg/µl, 1pg/µl and 0.1pg/µl. DNA at each concentration was amplified in quadruplicate with the PowerQuant™ System and Plexor® HY System. For each of these DNA quantification systems, 2µl of DNA was added per 20µl amplification reaction. All replicates of the 100pg/µl, 10pg/µl and 1pg/µl samples crossed the amplification threshold for the autosomal, Y and degradation targets with the PowerQuant™ System and the autosomal and Y targets with the Plexor® HY System (data not shown). DNA concentrations for the autosomal target were detected for eleven of the sixteen 0.1pg/µl replicates with the PowerQuant™ System and Plexor® HY System (Table 1, Plexor® HY data not shown).
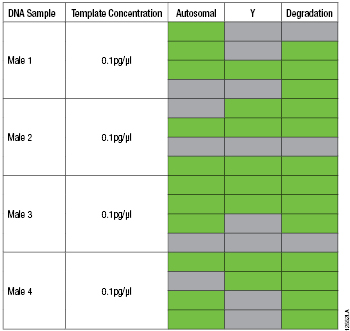 Table 1. PowerQuant™ System Results from Four Different Samples with 0.1pg/µl of Male Genomic DNA.
 Note: Each sample was amplified in quadruplicate. Green indicates that the amplification curve did cross the 0.2 amplification threshold within 40 cycles. Gray indicates amplification did not cross the 0.2 amplification threshold within 40 cycles.
The dilution series of the Male 1 genomic DNA was amplified with the PowerPlex® Fusion System. A total of 0.5ng was added to the STR amplification reaction for the 100pg/µl sample, but for the remaining samples the maximum input volume (15µl) was added per 25µl STR amplification reaction (150pg, 15pg and 1.5pg of template). Amplification reactions were analyzed using an Applied Biosystems® 3130 Genetic Analyzer and GeneMapper® ID-X software, version 1.4, with a 50RFU analysis threshold (Table 2).
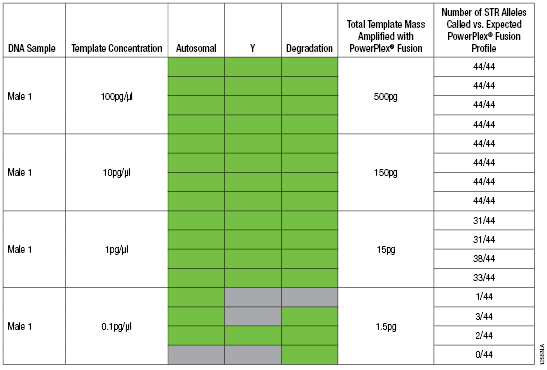 Table 2. PowerQuant™ System and PowerPlex® Fusion System Reactions with Decreasing Amounts of Male Genomic DNA Template.
 Note: PowerPlex® Fusion System amplification reactions were performed using the GeneAmp® PCR System 9700, and 1µl of each sample was analyzed using the Applied Biosystems® 3130 Genetic Analyzer. Green indicates that the amplification curve did cross the 0.2 amplification threshold within 40 cycles. Gray indicates amplification did not cross the 0.2 amplification threshold within 40 cycles.
[Auto]/[Y] Ratio
The primary advantage of multi-copy targets in a qPCR assay is the increased sensitivity of the amplification. However, the copy number can differ from individual to individual, resulting in variable [Auto]/[Y] ratios. The autosomal and Y targets selected for the PowerQuant™ System reduce the multi-copy effects on the [Auto]/[Y] ratio previously described with the Plexor® HY System (2) (3) . Genomic DNA from 79 different male individuals was amplified with the PowerQuant™ System and Plexor® HY System. The average [Auto]/[Y] ratio detected with the PowerQuant™ System was 1.16 ± 0.18. The average [Auto]/[Y] ratio detected with the Plexor® HY System was 1.29 ± 0.49. The range of [Auto]/[Y] ratios, calculated by subtracting the minimum from the maximum ratio, was 0.94 with the PowerQuant™ System and 2.92 with the Plexor® HY System (Figure 2).
 Figure 2. Scatter plot of the [Auto]/[Y] ratios obtained with the PowerQuant™ System and Plexor® HY System.
 (n = 79)
Degradation Target
The degradation target was included in the PowerQuant™ System to determine the degree of DNA degradation in a sample. Inclusion of an additional target to assess DNA degradation prior to STR genotyping has been used to evaluate DNA quality in casework-type samples (4) . The degradation target (294bp) in the PowerQuant™ System is longer than the autosomal and Y targets (136bp or less), increasing the likelihood that DNA degradation can be detected. Genomic DNA at a 10ng/µl concentration was degraded through exposure to increasing amounts of UV-C radiation. Genomic DNA with no UV-C exposure and exposure to 50mJ, 100mJ or 300mJ UV-C radiation was amplified using the PowerQuant™ System. Degradation was evaluated by comparing the DNA concentration measured with the autosomal target to the DNA concentration measured with the degradation target ([Auto]/[D]). These DNA samples were amplified with the PowerPlex® Fusion System and analyzed using the Applied Biosystems® 3130 Genetic Analyzer and GeneMapper® ID-X software, version 1.4, with a 50RFU analysis threshold. The increasing UV-C exposure corresponded to an increase in the [Auto]/[D] ratios (Table 3) as well as STR profiles exhibiting the characteristics of degraded DNA (Figure 3).
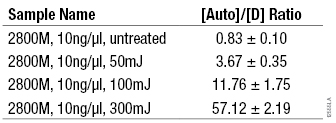 Table 3. Average [Auto]/[D] Ratios for DNA Exposed to Increasing Amounts of UV-C.
 (n = 4)
 Figure 3. PowerPlex® Fusion System amplification reactions containing 0.5ng of DNA exposed to increasing amounts of UV-C radiation.
 Amplification reactions were performed using the GeneAmp® PCR System 9700, and 1µl of each sample was analyzed using the Applied Biosystems® 3130 Genetic Analyzer.
Internal PCR Control
The presence of PCR inhibitors in casework samples can affect STR amplification and interpretation. The PowerQuant™ System was designed so that PCR inhibitors have a similar effect on the IPC as on STR amplification systems. The IPC target is long (435 base pairs), increasing its susceptibility to inhibitors relative to the shorter autosomal and Y targets. Amplification with the PowerQuant™ System was tested at two concentrations of humic acid (200ng/µl and 400ng/µl) in duplicate. To each 20µl PowerQuant™ System amplification reaction, 2µl of 0.1ng/µl of male genomic DNA was added. To mimic the volume of inhibitor that would carry over with this volume of DNA template, 2µl of humic acid at each concentration also was added (final humic acid concentrations of 20ng/µl and 40ng/µl, respectively). The average concentrations obtained with each target, the measured shift in the quantification cycle (Cq, also known as Ct) for the IPC (5) , as well as the [Auto]/[Y] and [Auto]/[D] ratios were calculated. The effect of humic acid on STR amplification was tested by adding humic acid at a concentration equivalent to 15µl of sample (maximum sample volume) per 25µl PowerPlex® Fusion System amplification reaction. The final inhibitor concentrations with either 200ng/µl or 400ng/µl humic acid were 120ng/µl or 240ng/µl, respectively. A sample was considered inhibited if the Cq shifted ≥0.5 cycles. The IPC Cq data were compared to STR profiles generated by amplifying 0.5ng of genomic DNA with the PowerPlex® Fusion System to demonstrate the correlation between the two systems (Table 4, Figure 4). Amplification reactions were analyzed using the Applied Biosystems® 3130 Genetic Analyzer and GeneMapper® ID software, version 3.2, with a 50RFU analysis threshold. Although the Cq for the IPC shifted, the DNA concentrations determined with the autosomal and Y targets were unaffected by the presence of humic acid. Despite the length of the degradation target, its amplification was also resistant to humic acid inhibition, preventing a false indication of sample degradation when humic acid was present.
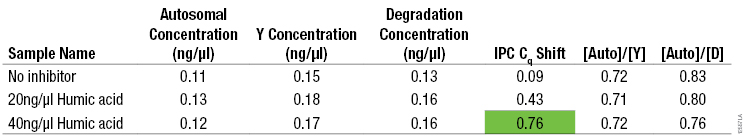 Table 4. Average DNA Concentrations, IPC Cq Shift, and [Auto]/[Y] and [Auto]/[D] Ratios for 0.1ng/µl Genomic DNA Amplified Using the PowerQuant™ System with Increasing Concentrations of Humic Acid.
 (n = 2). Note: The 0.1pg/µl genomic DNA was quantified by measuring absorbance at 260nm.
 Figure 4. PowerPlex® Fusion System amplification reactions containing 0.5ng of DNA with increasing concentrations of inhibitors.
 The top panel in each dye channel shows amplification results with no inhibitor. The middle panel shows results with 120ng/µl humic acid. The bottom panel shows results with 240ng/µl humic acid. Amplification reactions were performed using the GeneAmp® PCR System 9700, and 1µl of each sample was analyzed using the Applied Biosystems® 3130 Genetic Analyzer. Panel A. The fluorescein-labeled loci. Panel B. The JOE-labeled loci. Panel C. The TMR-ET-labeled loci. Panel D. The CXR-ET-labeled loci.
Conclusions
The PowerQuant™ System chemistry was designed so that the amplification sensitivity and tolerance to inhibitors are comparable to those of new STR systems (e.g., PowerPlex® Fusion and PowerPlex® Y23 Systems). The same levels of sensitivity are obtained with the PowerQuant™ System and Plexor® HY System. When no DNA is detected from a sample amplified using the PowerQuant™ System, a laboratory can be confident that no interpretable STR DNA profile will be detected. As with previous commercial quantification kits (e.g., Plexor® HY System), customers can use the [Auto]/[Y] ratio to determine the most appropriate STR system for obtaining the most informative DNA profile from an evidentiary sample. The [Auto]/[Y] ratio variance for single-source samples is reduced compared to that of the Plexor® HY System, allowing customers to better assess whether a sample includes a mixture of male and female DNA. Interpretation of the IPC Cq shift provides the analyst with information regarding the presence of PCR inhibitors and whether a sample is ready for STR amplification or if re-purification or dilution is necessary prior to STR amplification. The information obtained from the [Auto]/[D] ratio calculation is predictive of DNA quality. When humic acid was added to the amplification reaction, only the IPC was affected; the autosomal and Y targets reliably determined sample concentration, and the [Auto]/[D] ratio did not falsely flag the samples as degraded. The PowerQuant™ System can be used to predict the quality of an STR profile and determine DNA concentrations in approximately 1 hour. The faster thermal cycling conditions and 4-point standard curve allow a laboratory to test more samples, and the additional data generated with the PowerQuant™ System provide the laboratory with more information about the quality of DNA recovered from an evidence item, improving laboratory workflow.
Related Products
Article References
- Holland, P.M. et al. (1991) Detection of specific polymerase chain reaction product by utilizing the 5′→3′ exonuclease activity of Thermus aquaticus DNA polymerase. Proc. Natl. Acad. Sci. USA 88, 7276–80.
- Krenke, B.E. et al. (2008) Developmental validation of a real-time PCR assay for the simultaneous quantification of total human and male DNA. Forensic Sci. Int. Genet. 3, 14–21.
- LaSalle, H.E., Duncan, G. and McCord, B. (2011) An analysis of single and multi-copy methods for DNA quantitation by real-time polymerase chain reaction. Forensic Sci. Int. Genet. 5, 185–93.
- Hudlow, W.R. et al. (2008) A quadruplex real-time qPCR assay for the simultaneous assessment of total human DNA, human male DNA, DNA degradation and the presence of PCR inhibitors in forensic samples: A diagnostic tool for STR typing. Forensic Sci. Int. Genet. 2, 108–25.
- Bustin, S.A. et al. (2009) The MIQE guidelines: Minimum information for publication of quantitative real-time PCR experiments. Clin. Chem. 55, 611–22.
How to Cite This Article
Scientific Style and Format, 7th edition, 2006
Ewing, M.M. et al. The PowerQuant™ System: A New Quantification Assay for Determining DNA Concentration and Quality. [Internet] 2014. [cited: year, month, date]. Available from: https://www.promega.kr/resources/profiles-in-dna/2014/the-powerquant-system-a-new-quantification-assay-for-determining-dna-concentration-and-quality/
American Medical Association, Manual of Style, 10th edition, 2007
Ewing, M.M. et al. The PowerQuant™ System: A New Quantification Assay for Determining DNA Concentration and Quality. Promega Corporation Web site. https://www.promega.kr/resources/profiles-in-dna/2014/the-powerquant-system-a-new-quantification-assay-for-determining-dna-concentration-and-quality/ Updated 2014. Accessed Month Day, Year.
Contribution of an article to Profiles in DNA does not constitute an endorsement of Promega products.
Plexor and PowerPlex are registered trademarks of Promega Corporation. PowerQuant is a trademark of Promega Corporation.
Applied Biosystems and GeneMapper are registered trademarks of Applied Biosystems. GeneAmp is a registered trademark of Roche Molecular Systems, Inc.
Products may be covered by pending or issued patents or may have certain limitations. More information.
All prices and specifications are subject to change without prior notice.
Product claims are subject to change. Please contact Promega Technical Services or access the Promega online catalog for the most up-to-date information on Promega products.